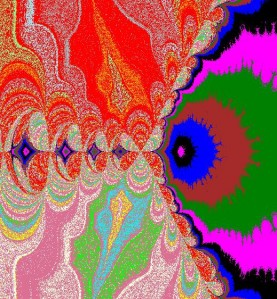
For anyone who has studied calculus, the Newton-Rhapson method should be familiar. To those who have not, I do apologize if I lose you, but will try to make it easy. mybloggingplanet.com
The Newton-Rhapson method is a way to find the roots of a function using approximations.
So, for the non-maths people out there, a function is denoted by f(x) and can be any equation, for example f(x) = x^2 + 3, or f(x) = sin(x). Now, the roots of a function are defined by f(x) = 0, so it is wherever the function equals zero.
Another important concept here is the derivative f’(x). This is the rate of change of the function f(x), but by going any deeper, I know I will lose the non-maths guys, and I am sure any of you who know some maths already know about derivatives.
The Newton-Rhapson method tries to find the values of the root by approximating the root, and then iterating using the procedure a’ = a – f(a)/f’(a) where a is the approximated root, and a’ is the closer approximation. The procedure is then repeated replacing a with the new a’ value, as many times as is needed to achieve the required accuracy.

Newton Rhapson
So how the function that generates the fractal works, first we take our canvas, and iterating through each pixel in the canvas, we get x and y values, which are made up of the minimum values – which are passed as a parameter, so that we can view any part of the Cartesian space – and then add to that the column (or row) we are on multiplied by the scaling factor.
Now that we have our values we are going to pass into our function, and have set up a few values before we iterate, we start the iteration.
We keep on iterating, using the Newton-Rhapson method to find new values for x and y, and finally finished iteration when either we have reached a point where the values are as accurate as they are ever going to be, or else we have reached the amount of iterations we are going to allow.
Now that we have done that, we can select the color to draw at that particular point. We have created an array of 16 colours, and then depending on values of x and y, we use certain colours, based on the iteration in which we reached our value.
If x is larger than 0, then the first 5 colours are used. If y > 0 and x is less than -0.3 then the next 5 colours are used, and for everything else the last 6 colours are used.
The full source code is available here
		Color[] oColor = new Color[16];

               //I put this code to set the colours into the class constructor. It is here purely to show which colours I have used.
		oColor[0] = Color.Black;
		oColor[1] = Color.Blue;
		oColor[2] = Color.Brown;
		oColor[3] = Color.Green;
		oColor[4] = Color.Magenta;
		oColor[5] = Color.Orange;
		oColor[6] = Color.Red;
		oColor[7] = Color.DarkGray;
		oColor[8] = Color.LightBlue;
		oColor[9] = Color.LightGreen;
		oColor[10] = Color.LightYellow;
		oColor[11] = Color.PaleVioletRed;
		oColor[12] = Color.Ivory;
		oColor[13] = Color.Yellow;
		oColor[14] = Color.Cyan;
		oColor[15] = Color.Lime;
		}

		public void Generate(Graphics g, int iIterations, int iSize, double XMax, double XMin, double YMax, double YMin, int iWidth, int iHeight)
		{
			int flag, iColor, col, row, i;
			double deltaX, deltaY, X, Y, Xsquare,Xold,Yold;
			double Ysquare,denom;

			deltaX = (XMax - XMin)/(iWidth);
			deltaY = (YMax - YMin)/(iHeight);
			for (col = 0; col < iWidth; col++)
			{
				for (row = 0; row < iHeight; row++)
				{
					X = XMin + col * deltaX;
					Y = YMax - row * deltaY;
					Xsquare = 0;
					Ysquare = 0;
					Xold = 42;
					Yold = 42;
					i = 0;
					flag = 0;
					while ((i <= iIterations) && (flag == 0))
					{

						Xsquare = X*X;
						Ysquare = Y*Y;
						denom = 3.0*((Xsquare - Ysquare)*(Xsquare - Ysquare) + 4.0*Xsquare*Ysquare);
						if (denom == 0)
						{
							denom = 0.00000001;
						}
						X = 0.6666667*X + (Xsquare - Ysquare)/denom;

						Y = 0.6666667*Y - 2.0*X*Y/denom;
						if ((Xold == X) && (Yold == Y))
						{
							flag = 1;
						}
						Xold = X;
						Yold = Y;
						i++;
					}
					if (X > 0)
					{
						iColor = i % 5;
					}
					else
					{
						if ((X < -0.3) && (Y > 0))
						{
							iColor = (i % 5) + 5;
						}
						else
						{
							iColor = (i % 6) + 10;
						}
					}
					g.FillRectangle(new SolidBrush(oColor[iColor]),col, row, 1, 1);
				}
			}

		}
Comments